in utramque partem

Figure 1: Network graph of the Perth music scene.
Where interests convene, activities become truly engaging. In this case, my interest in music, and local punk music in particular, meets my fascination for visualising data as well as my attraction to creating order in chaos.
Until a few years ago, RTRFM ran a segment by Ross Chisholm during the morning show, The Land that Time Forgot. It taught me musicians wanting to play in a band often end up in a number of them in Western Australia. Anecdotally, I know many try their luck on the east coast of Australia as well, but that oftentimes happens after they've been in a few bands in Perth already too.
Using a technique called network analysis and drawing on MusicBrainz data, I've put together a visualisation of the bands originating in Western Australia, with the relationship between the bands being their band members.
Performing this analysis was made possible with the help of several R libraries. First, the httr2 library is a joy to work with. Once you get up the learning curve far enough to understand it, it really makes a difference in how you can responsibly get data out of API-enabled services. The purrr library makes accessing nested data structures very intuitive. I didn't fully appreciate the versatility of the format until I tried processing the queried data from the MusicBrainz API. Having access to verbs like unnest, hoist and pluck proved invaluable. Graph analysis in R is supported by igraph, tidygraph and ggraph.
When plotting the relationships in a first attempt of visualising them, I ended up with an aesthetically pleasing result seen above, but it didn't allow me to make many real observations about the subgroups of bands leaning on the same musicians. The main thing that jumped out was the isolated nature of the West Australian Symphony Orchestra. I'm reminded of Pac-Man when I look at the musical landscape this way. The graph suffers from what is called small-world effect. Nodes are typically only connected via a few links - lots of musicians play only ever in 1 band, those that play in multiple bands also only can do so in a limited number of them, and most bands have no more than 4 or 5 members (a singer, 1 or 2 guitarists, a bass player and a drummer for punk bands).
A brief web search taught me several approaches exist to deal with this problem. One of them, the backbone graph layout, looked promising as it emphasises a hidden group structure if it exists in the graph. The R function layout_as_backbone from the graphlayout package calculates a layout for a sparsified network only including the most embedded edges. Deleted edges are added back after the layout is calculated. The actual reduction in nodes and edges using the underlying algorithm wasn't high though, so while this approach yields a satisfying result already, I decided to look a bit deeper into the data.
Turns out there were about 150 components in the graph - groups of artists and bands that have no connections with other groups. This makes the above technique not the appropriate one to use, as the dataset does not contain a spanning subgraph connecting the band members. (Adding more information about family and school relationships would probably unveil some further insights, let alone bringing in the style of music played by bands.)
Using Thomas Lin Pedersen's tidygraph package, it was actually super easy to identify the disconnected groups of bands and their members in the graph, and filter out the biggest groups.
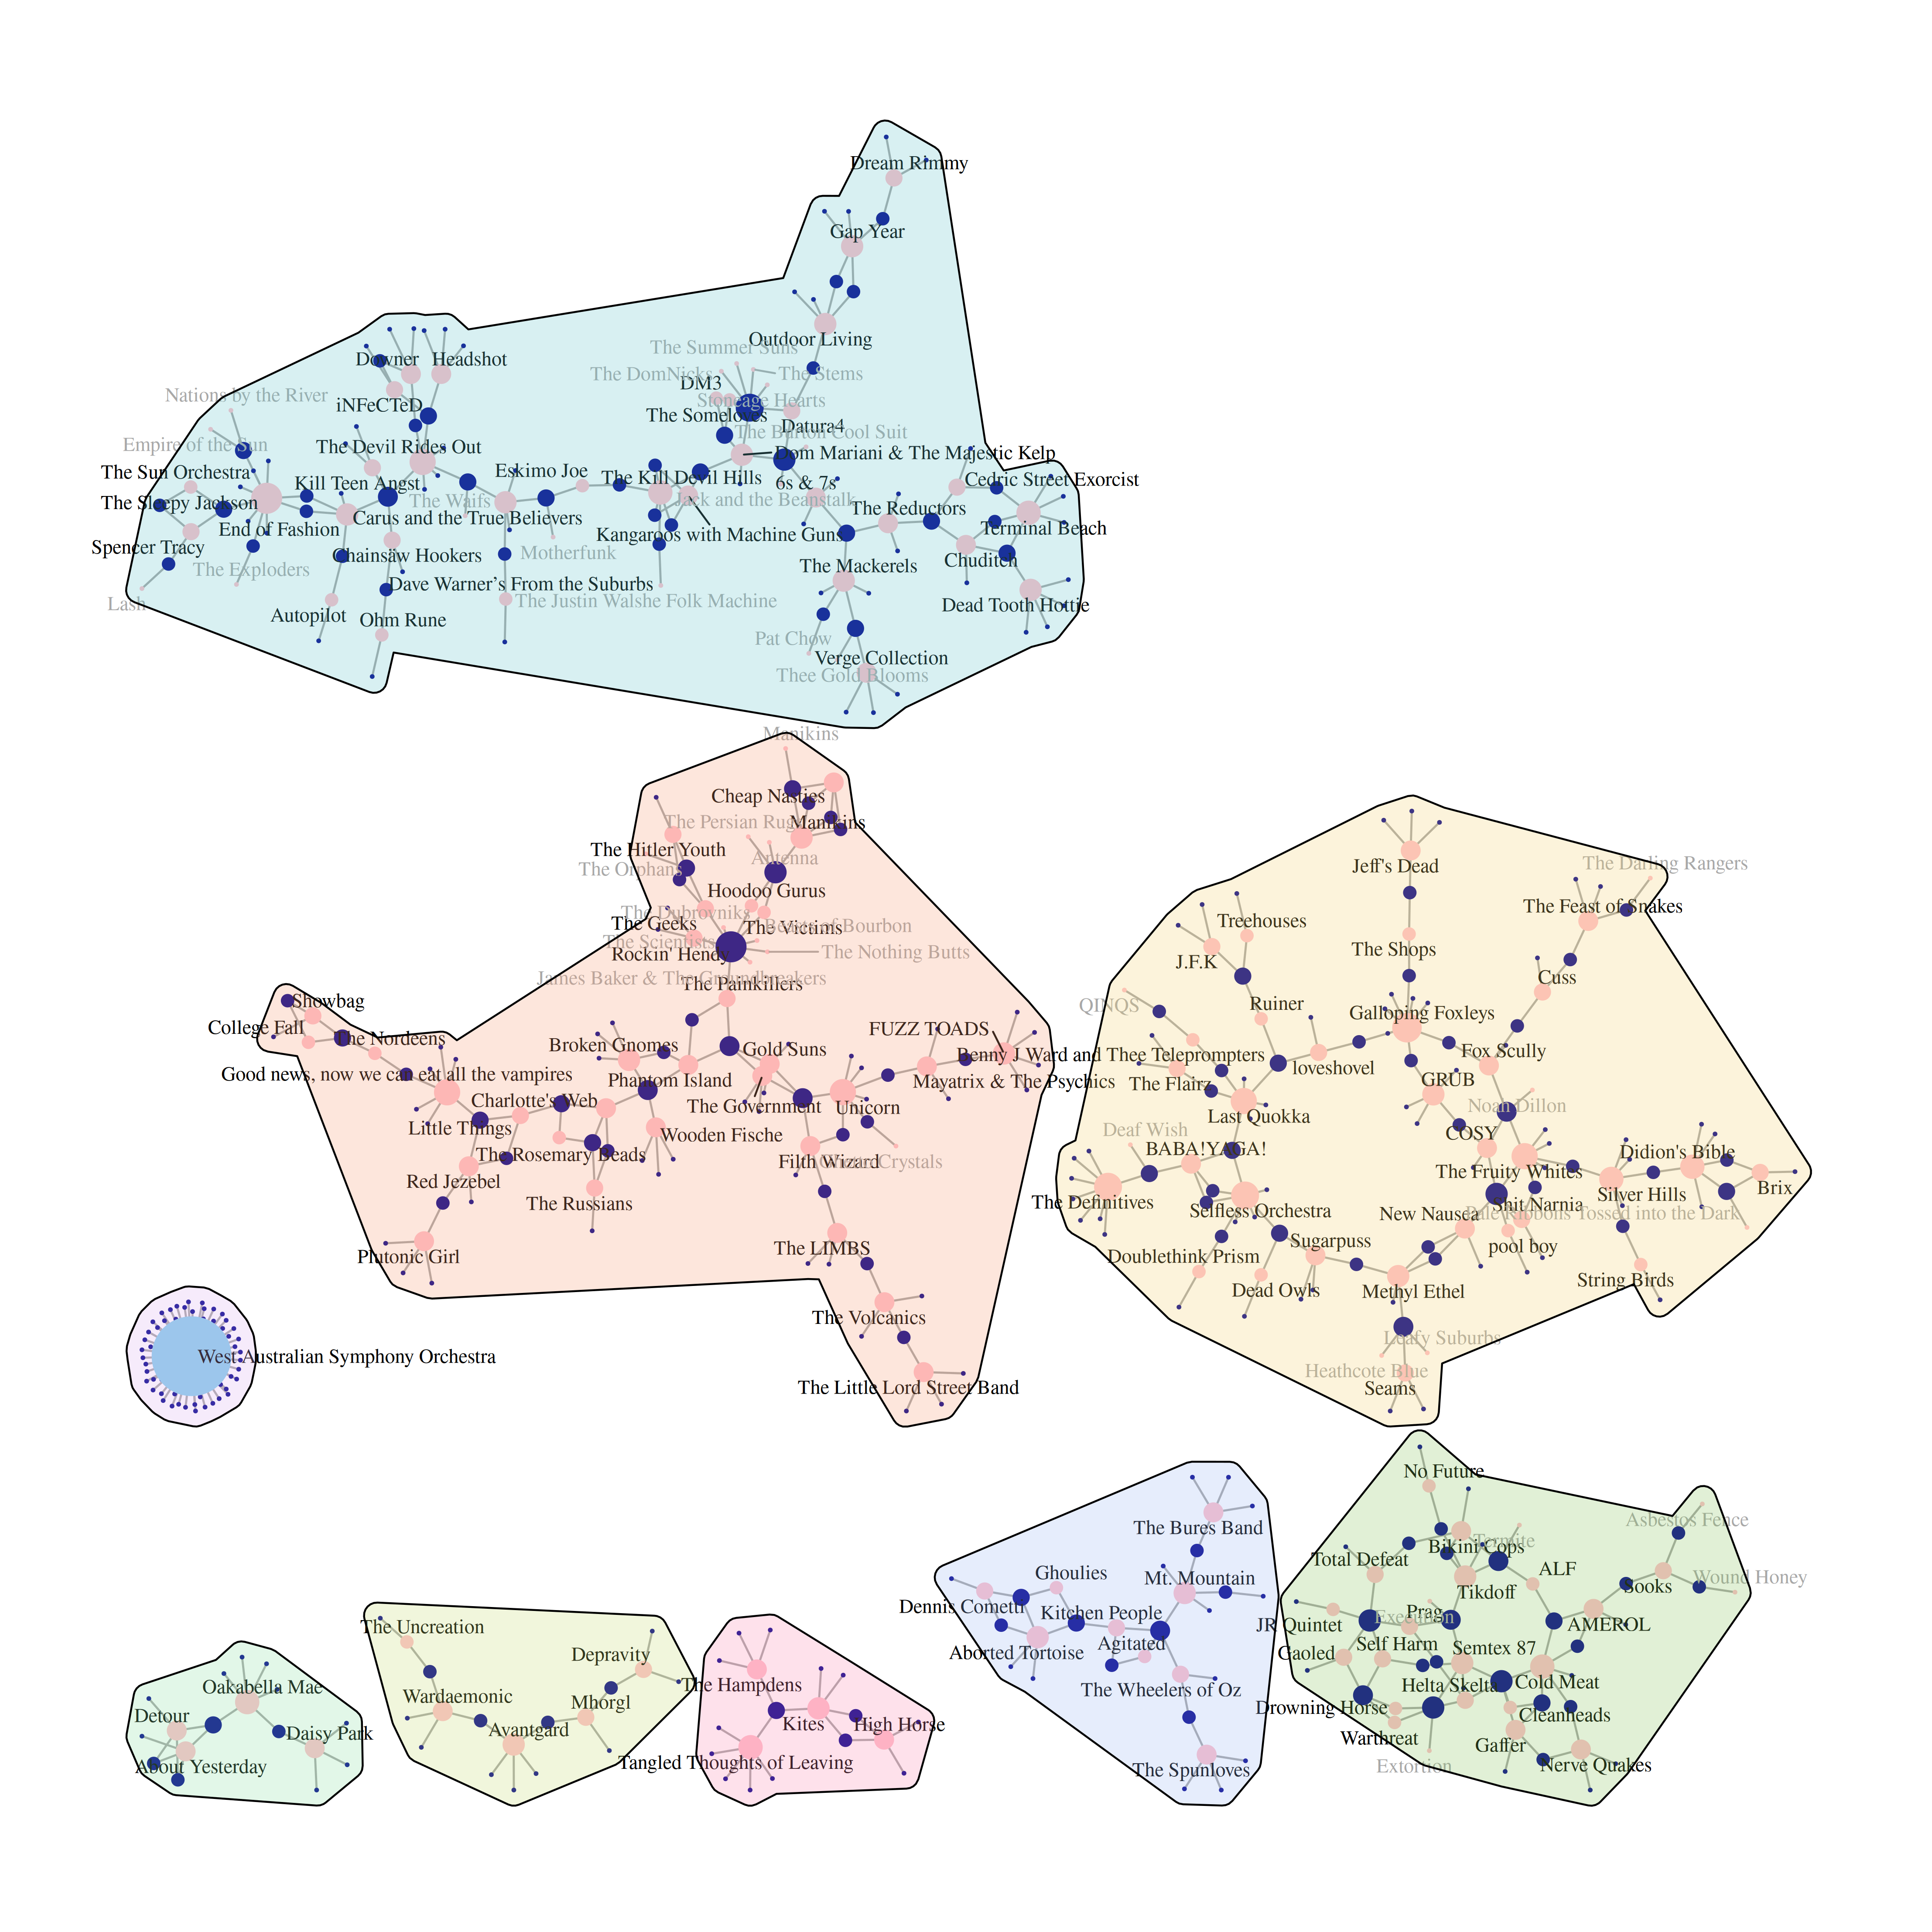
Figure 2: Network graph of the most connected bands in the Perth music scene.
As with any database, the information you get out of it is only as good as the care that has gone into curating the data going into it. The MusicBrainz project, an open music encyclopedia, has been going for over 25 years, and is maintained by a global community of users. Despite the isolated nature of Perth and Western Australia, it's absolutely impressive how much you can find out in the database about artists and bands that have called the city and state home.
The code to re-create the analysis is available on my git server.
Posted on Monday 2 June 2025 at 22:20