The Internet Archive contains a dataset from the NYC Taxi and Limousine Commission, obtained under a FOIA request. It includes a listing of each taxi ride in 2013, its number of passengers, distance covered, start and stop locations and more.
The dataset is a wopping 3.9 GB compressed, or shy of 30 GB uncompressed. As such, it is quite unwieldy in R.
As I was interested in summarised data for my first analysis, I decided to load the CSV files in a SQLite database, query it using SQL and storing the resulting output as CSV file again - far smaller though, as I only needed 2 columns for each day of the 1 year of data.
The process went as follows.
First extract the CSV file from the 7z compressed archive.
7z e ../trip_data.7z trip_data_1.csv
and the same for the other months. (As I was running low on disk space, I had to do 2 months at a time only.) Next, import it in a SQLite db.
echo -e '.mode csv \n.import trip_data_1.csv trips2013' | sqlite3 NYCtaxi.db
Unfortunately the header row separates with ", ", and column names now start with a space. This does not happen when importing in the sqlite3 command line - tbd why. As a result, those column names need to be quoted in the query below.
Repeat this import for all the months - as mentioned, I did 2 at time.
Save the output we need in temporary csv files:
sqlite3 -header -csv trips2013.db 'select DATE(" pickup_datetime"), count(" passenger_count") AS rides, sum(" passenger_count") AS passengers from trips2013 GROUP BY DATE(" pickup_datetime");' > 01-02.csv
Remove the archives and repeat:
rm trip_data_?.csv
rm trips2013.db
Next, I moved on to the actual analysis work in R.
Looking at the number of trips per day on a calendar heatmap reveals something odd - the first week of August has very few rides compared to any other week. While it's known people in NY tend to leave the city in August, this drop is odd.
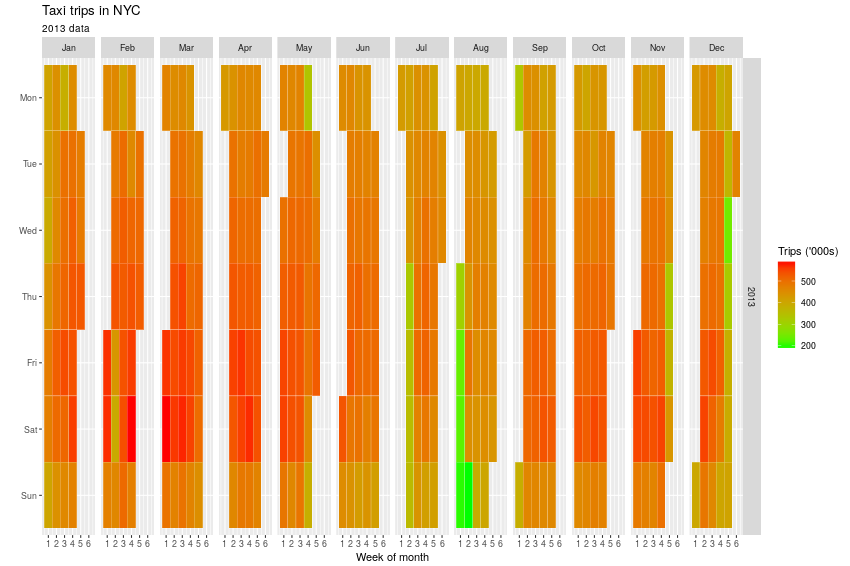
Figure 1: Calendar heatmap of trips
Deciding to ignore August altogether, and zooming in on occupancy rate of the taxis rather than the absolute number or rides, reveals an interesting insight - people travel together far more in weekends and on public holidays!
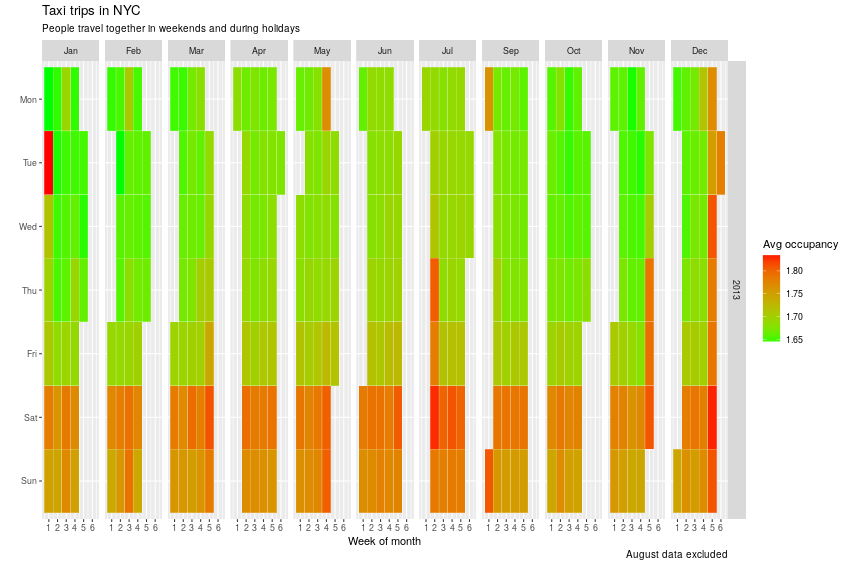
Figure 2: Occupancy heatmap
Just looking at the calendar heatmap it's possible to determine 1 Jan 2013 was a Tuesday and point out Memorial Day as the last Monday of May, Labour day in September, Thanksgiving day and even Black Friday at the end of November, and of course the silly season at the end of the year!)
The dataset contains even more interesting information in its geo-location columns I imagine!
Posted on Thursday 30 November 2017 at 21:36