Getting used to the grammar of ggplot2 takes some time, but so far it's not been disappointing. Wanting to split a
scatterplot by segment, I used facet_grid. That by default shows a
label on each subplot, using the values in the variable by which the
plot is faceted.
As that often isn't very descriptive in itself, there needs to be a way
to re-label these subplots. That way is as_labeller, as shown in the
example code below.
Example:
ggplot(outputs, aes(x = date_var,y = value_var), alpha = 0.8) +
  geom_point(aes(y = value_var, colour = colour_var)) +
  geom_smooth() +
  theme(legend.position = "none",
        axis.text.y = element_blank(),
        axis.text.x = element_blank()) +
  scale_x_date(date_breaks = '1 week') +
  labs(y = "Value", x = "Date",
  title = "Example") +
  scale_colour_manual("Legend", values = named_coloring_vector)) +
  scale_fill_manual(“", values = c("grey12”)) + facet_grid(. ~ Segment,
  labeller = as_labeller(c("yes" = "Segment A", "no" = "Segment B")))
Output:
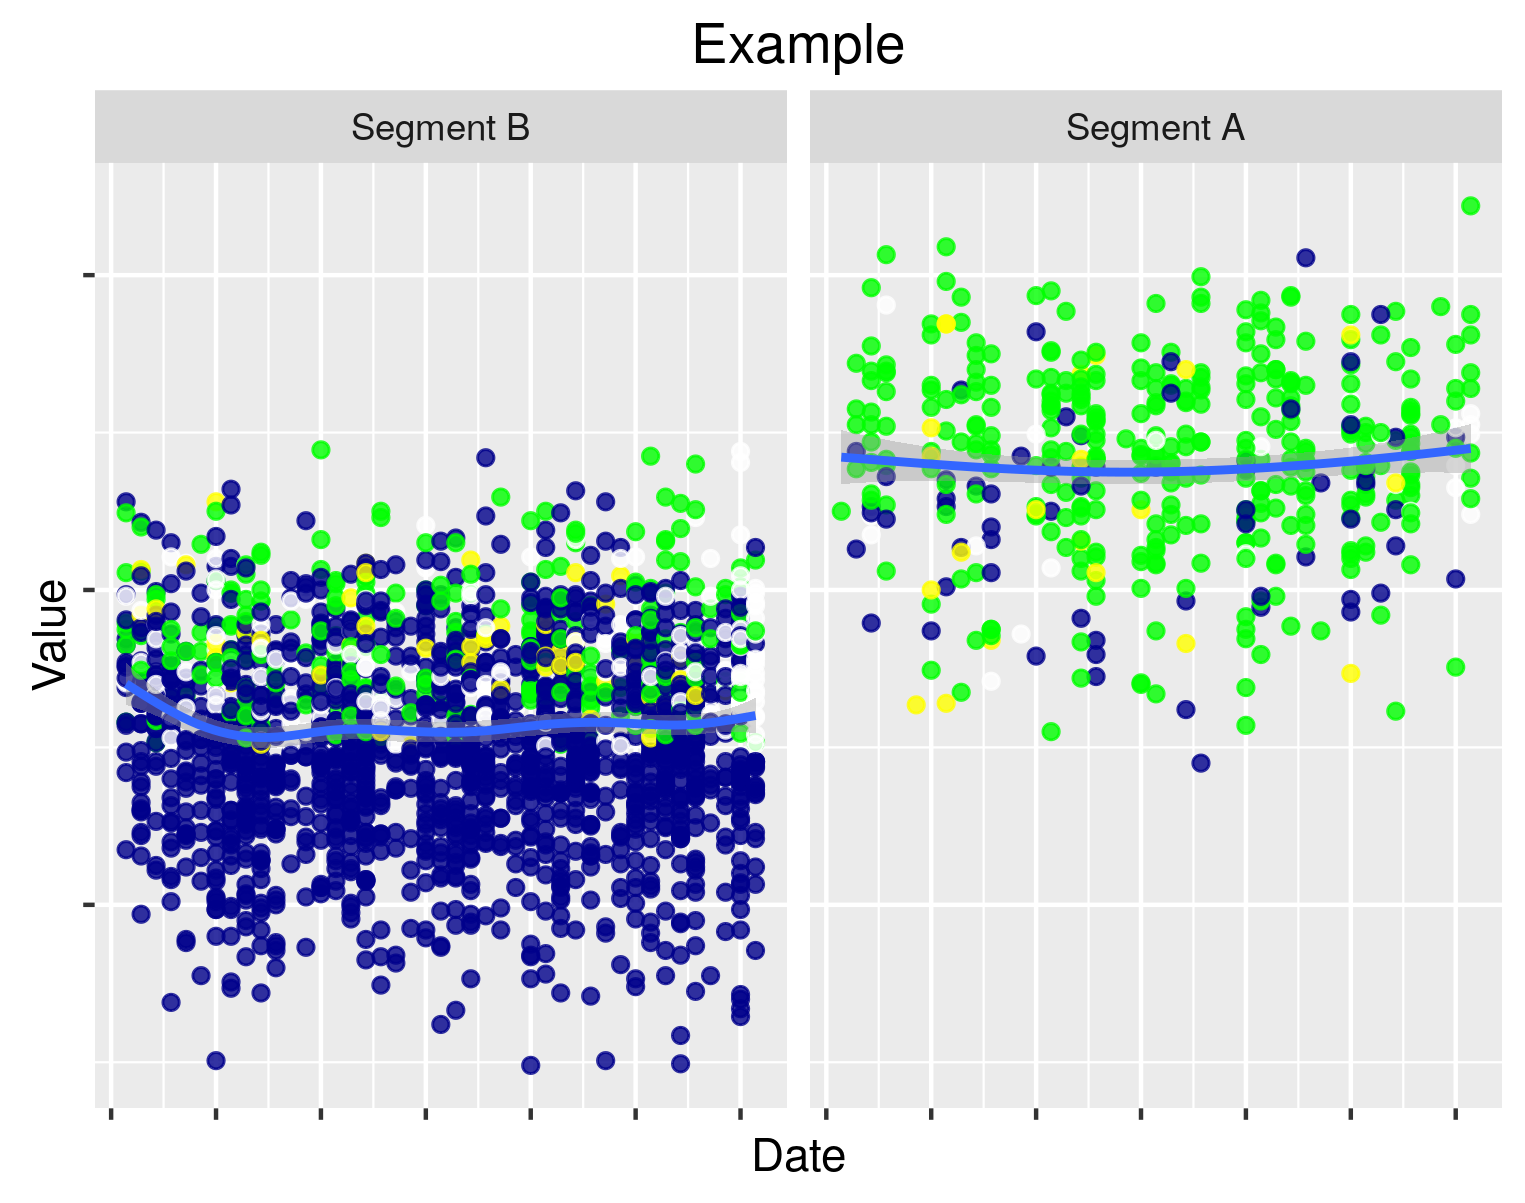
Figure 1: Example plot with 2 facets labelled Segment B and Segment A.
Posted on Wednesday 5 October 2016 at 21:48