In a process labelled the energy transition, traditional sources for electricity generation are being replaced by renewable energy sources like wind and solar. To the extent this happens 'behind the meter', i.e. where the user of the electricity is generating & consuming it on their own premises like with rooftop solar panels, it results in the metered demand on the electricity grid not being aware of the demand that is met by on-site generation. Given how prevalent solar panels have become on Western Australian roofs over the past 10 years, it might not come as a surprise this has resulted in the remaining demand on the grid to come down on very sunny days around noon. This reduction has been quite rapid for a couple of years, but seems to have slowed this year and last, as seen in the graph below.
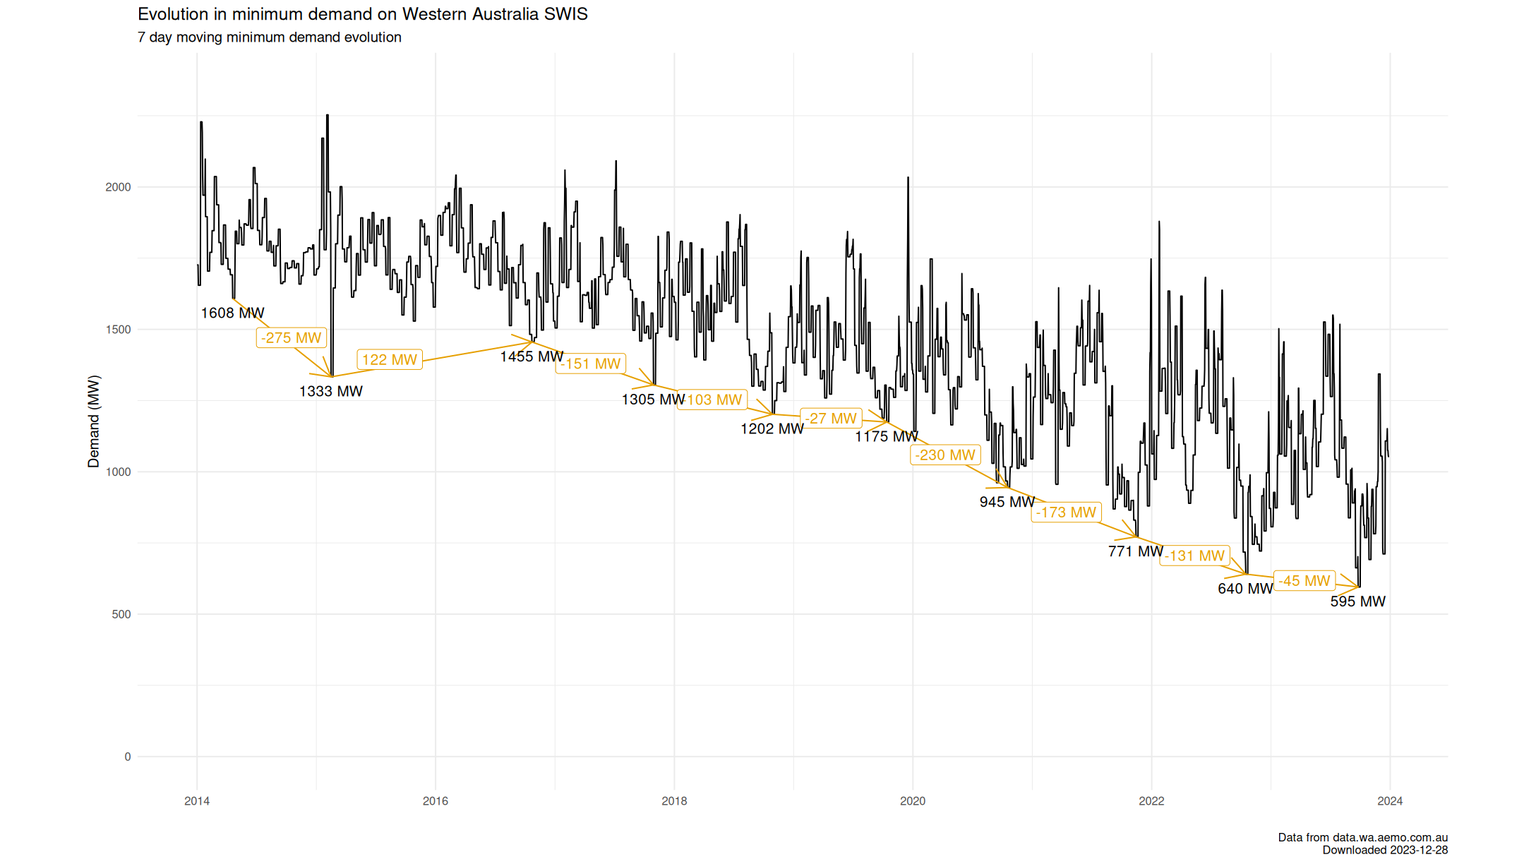
To create the graph, I calculate the 14-day running minimum of the daytime demand on the grid, starting back in 2014. For each year, the minimum that was reached is shown, as is the year-on-year difference between them. Since 2016, these minima have always been achieved during the Australian springtime. The 2015 minimum jumps out, as it happened during summer and it took another 2.5 years to equal it again - I imagine it is linked to an outage of an industrial consumer of electricity.
Posted on Thursday 28 December 2023 at 21:52